Research into the vulnerable PHPCoinAddress wallet generation and the relevant fallout.
Table of Contents
PHPCoinAddress Analysis
Introduction
In part one, I described the PHPCoinAddress vulnerability, background, and known variations. Here in part two, I present a summary of weak wallets discovered so far as well as their history. Note that due to to the underlying PRNG mechanics and their usage by PHP, the relevant search space is a lot larger than the 2^32 candidates (times two PRNG variants) that one may naively expect just from possible PRNG seed values. The provided results come from searching about 2^41 private key candidates for MT_RAND_PHP and 2^40 candidates in MT_RAND_MT19937 with the PHPCoinAddress pattern.
Therefore, the presented numbers are known to be incomplete, but should give a good first approximation of the relevant ranges. Additional searching consistently leads to finding more wallets, especially for MT_RAND_PHP, but at a diminishing rate. I expect that I’ve found more than half of the relevant wallets and transactions overall. More details on the PRNG output offsets may follow in a separate part of this series.
Statistics
Here is an overview, grouped by PHP PRNG type and coin usage:
| PHP version range | type | unique wallets | unique PRNG seeds | total transaction volume | first activity | Notes |
|---|---|---|---|---|---|---|
| MT_RAND_PHP | BTC | 17652 | 10573 | 7713.5 BTC | 2012-10 | |
| MT_RAND_MT19937 | BTC | 2919 | 2733 | 10.3 BTC | 2017-10 | |
| MT_RAND_PHP | BCH | 10007 | 7329 | Mostly pre-BCH hardfork usages of BTC | ||
| MT_RAND_MT19937 | BCH | 1 | 1 | |||
| MT_RAND_PHP | LTC | 612 | 467 | |||
| MT_RAND_MT19937 | LTC | 43 | 40 |
Technical notes (click to unfold)
- Includes wallets at non-zero PRNG output stream offsets
- Wallets generated from the same PRNG seed were likely created by the same entity/system
- Wallet search is not exhaustive due to large search space, numbers represent a lower bound
- See previous article for
PHPCOINADDRESSderivation and PHP PRNG type details
I’ve published the discovered weak addresses to the milksad data repository.
The total historic transaction volume of over 7700 BTC is certainly massive, and reflects the significant usage of the vulnerable software in the earlier days of Bitcoin. It should be noted, though, that most of these transactions happened while the price per Bitcoin was much lower than it was in more recent years, consequently the overall monetary value is lower than this number first suggests. However, the value just the Bitcoin alone that moved through these wallets is still substantial, in the range of millions of dollars. In an ideal world, none of which should have ever touched such weak wallets.
The Litecoin-related numbers confirm that the PHPCoinAddress pattern was also used to create wallets for other coin types with a similar construction to Bitcoin, if the relevant coin types were available and popular at the time.
To give more insight into the wallet usage over time and potential theft events, I’ve prepared a series of graphs that outline the different combined properties of the so-far discovered Bitcoin wallet clusters, separated by their PRNG implementation type.
History for PHPCoinAddress on MT_RAND_PHP
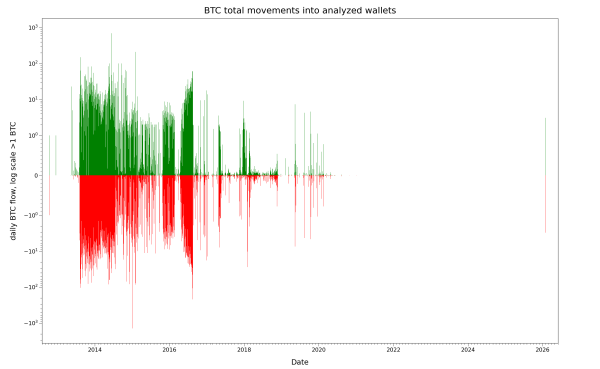
Let’s start with a broad view of the complete history on the most active range. In this view, both the incoming and outgoing daily volumes are shown in green and red, respectively. Note that the Y-axis is partially logarithmic (linear scale from -1 to 1 BTC, log scale otherwise) to squeeze the three orders of magnitudes in the observed transaction volume into one image.
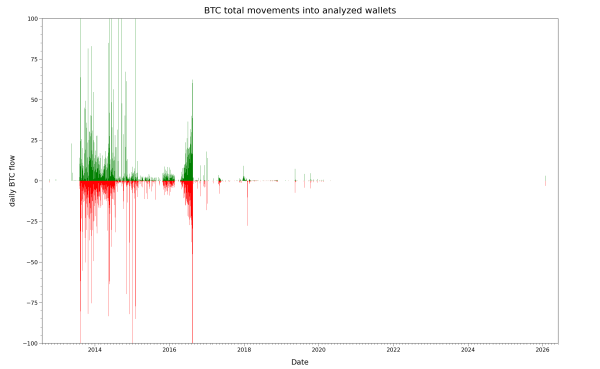
Here is a normal view over the same time-scale with a clipped but linear Y-axis. This configuration makes it easier to visually compare trends in the daily usage:
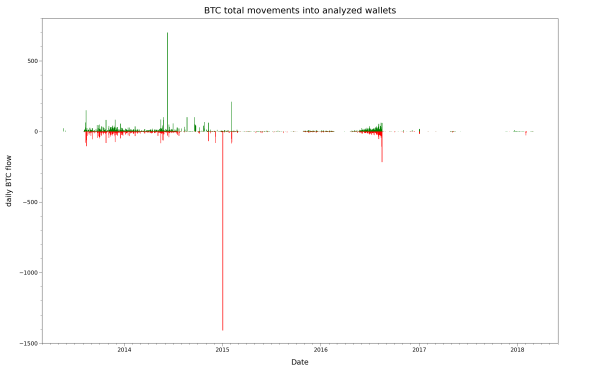
Focusing on the most active time range from late 2013 to early 2018 shows the magnitude of some particularly active days:
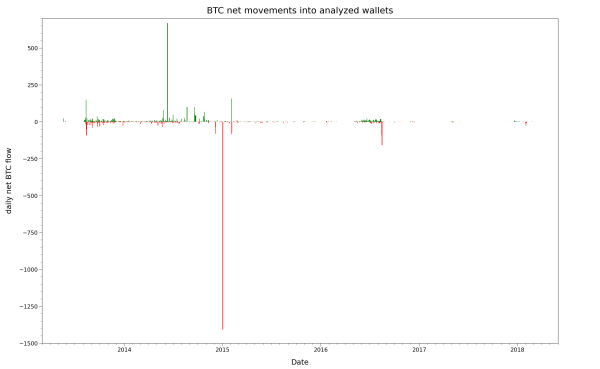
Switching to a different approach, the next graph only shows the daily calculated “net” result of incoming minus outgoing funds, focusing on multi-day trends. Take note of the red spikes of outgoing funds in early 2015, late 2016, and early 2018.
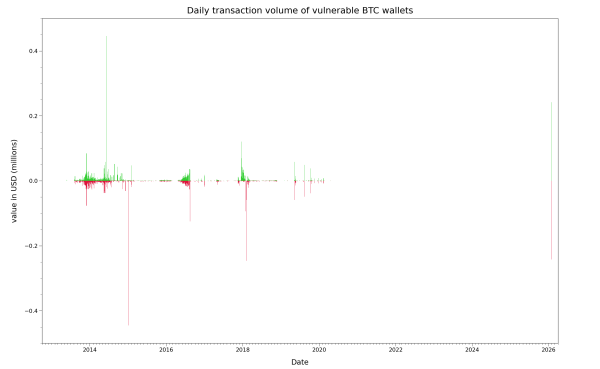
Daily transfers give us a helpful understanding of the normal day-to-day activity level, and can highlight special days with unusual transfer volumes. Due to the massive fluctuations of value per Bitcoin throughout the whole time range, I’ve prepared a separate graph showing the estimated dollar value at transfer time, with both incoming and outgoing funds visible at the same time. This view helps to normalize the different price-related effects and compare them visually.
The following graph looks at how the overall “balance” of this weak wallet range, summed up across relevant discovered wallets, has changed over time:
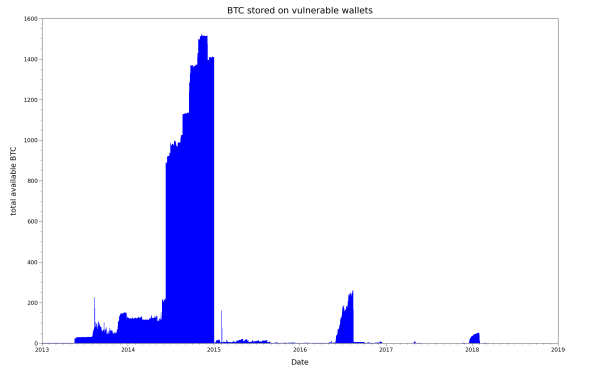
As you can see very clearly in this visualization, the previously mentioned spikes of unusually high outgoing daily transaction values in early 2015, late 2016 and early 2018 correspond to radical withdrawals of virtually all available funds across all tracked wallets within very short time spans. Assuming that at least some of the wallets were controlled by different owners, this an unusual coincidence, and best explained by an attacker rapidly sweeping funds after brute-forcing their private keys. There appear to be at least three such major events over a roughly three year period, raising interesting questions about the behavior patterns of one or multiple attackers. If they had sustained their searches and automated their attacks for multiple years, weak wallets in this range would not have been able to accumulate substantial funds again.
Additionally, it also opens up questions about the foolishness of developers (and users?) who repeatedly ran into a long-disclosed issue - first made public in 2013 - multiple times after what looks like massive in-the-wild exploitation and thefts of user funds.
You’ll have noticed that in the graph, the relevant peak of combined Bitcoin value at risk gets much smaller over time, dropping from 1400 BTC in 2015 vs. about 50 BTC in 2018. Here, as mentioned previously, the increase of price per Bitcoin led to a decrease in traded Bitcoin volume, but not necessarily in the overall monetary value that was stored in the wallets.
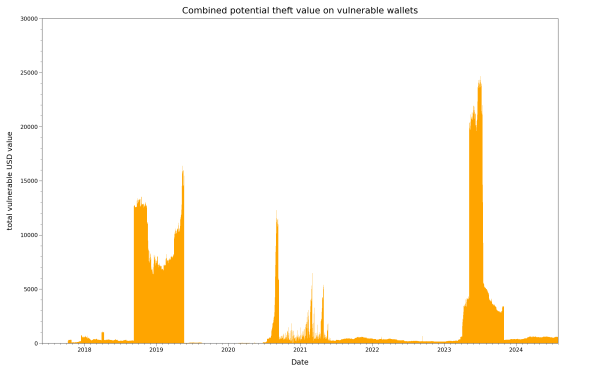
The following view calculates the equivalent value of the available Bitcoin, normalizing for the relevant price changes:
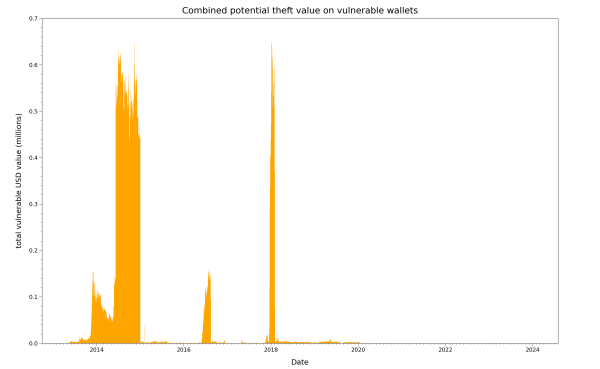
As you can see from the graph, the monetary value present in this range was roughly comparable in early 2015 and 2018, while the late-2016 value was significantly lower. Note that this consideration focuses on the remaining amount that isn’t yet stolen, calculated daily. This metric is different from the combined value that an attacker could steal in repeated attacks - for example, if the attacker continues to steals all incoming funds over a period of several days and weeks, and vulnerable users keep depositing new funds into the attacker’s reach.
Reminder: since legitimate outgoing transactions and thefts can’t be clearly distinguished with 100% accuracy, all indications for thefts are speculative and should be treated as such. Due to the incomplete wallet data, these graphs represent an approximation of the real activity, mostly as a lower bound.
History for PHPCoinAddress on MT_RAND_MT19937
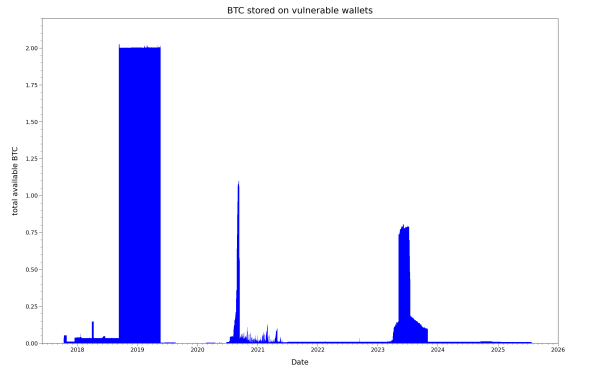
The following graphs are for weak wallets generated by PHPCoinAddress in combination with the newer MT_RAND_MT19937 PHP mt_rand() implementation. Overall usage and funds at risk were a lot lower, which is generally plausible to me considering the previously mentioned real-world attacks which appeared to have been public knowledge at this point, and age of the vulnerable library. Still, some projects or end users apparently continued to use the problematic code, or newly included it into active projects.
Let’s begin with the view on remaining Bitcoins:
Equivalent USD, to reflect Bitcoin prince changes:
As you can tell, the stakes in the MT_RAND_MT19937-related range are 10-20x lower than in the previously shown MT_RAND_PHP, since less overall value was at risk at any given point.
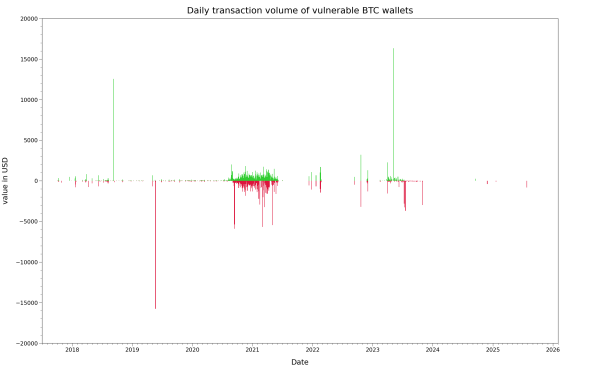
The view of daily transfers, here normalized to USD, shows that there was still a decent amount of activity in different time periods:
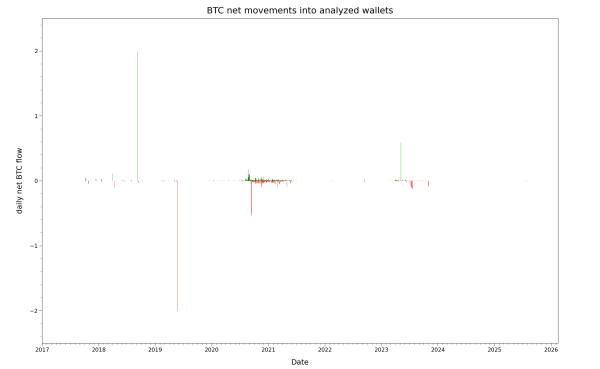
Here are the daily net changes:
Outlook
Some more details are planned to be included in part three of this series.
If you like this type of analysis, head over to research update #10 where I covered a similar approach for the Cake Wallet vulnerability.
As always, feedback from other researchers is welcome via email!